
Welcome to Jeks Analytics—your gateway to mastering data analytics and empowering your tech journey!
Are you ready to dive into the exciting world of data analytics, machine learning, and data science projects?
Our channel is your one-stop destination for gaining hands-on expertise in industry-leading
tools like Power BI, Tableau, Excel, and harnessing the potential of Python for data analysis.
Whether you're a tech enthusiast that's just starting, or a seasoned professional seeking to expand your skill set, this
channel is designed for you. We offer easy-to-follow tutorials, practical tips, and real-world case studies to demystify complex
concepts and help you excel in this data-driven era.
Join our community of passionate learners, subscribe now, and embark on a journey that will unlock countless opportunities
in the data analytics landscape. Let's empower your tech dreams together!
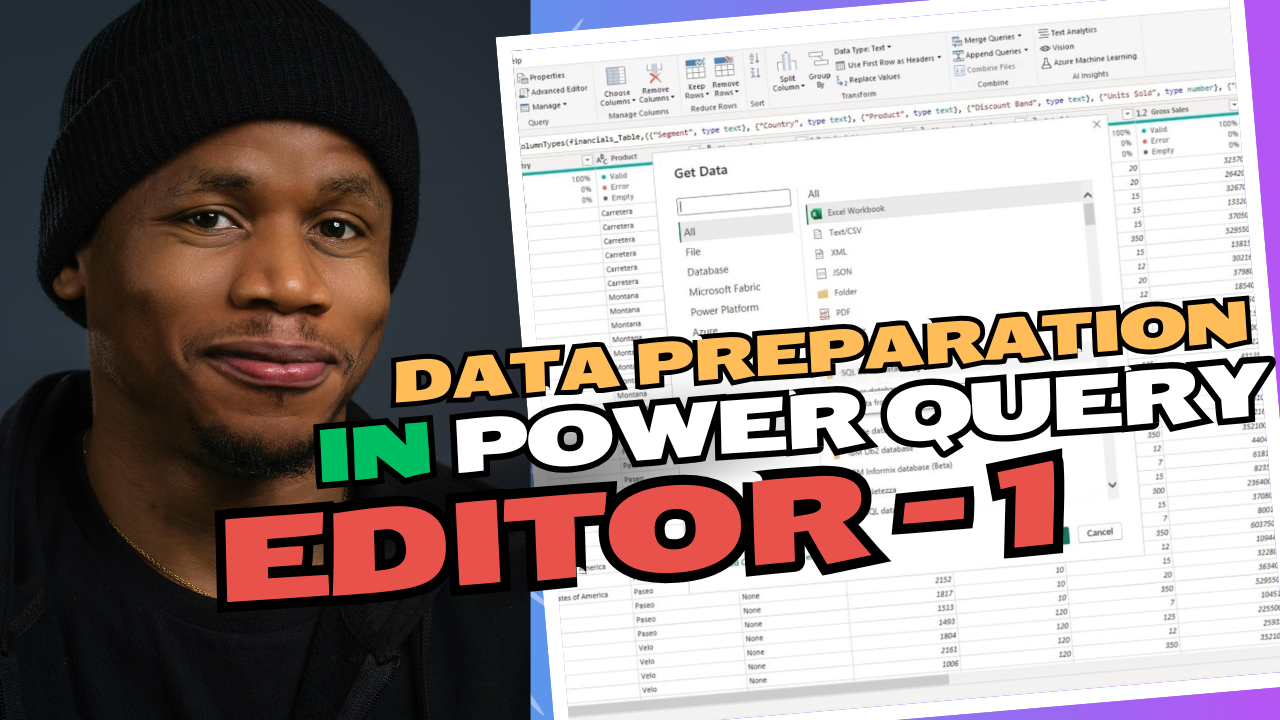
In this tutorial, we kicked off our Power Query journey by exploring how to import data from different sources like Excel files, CSVs,
and even web-based datasets! Whether you're just starting out or looking to polish your data skills, this video is perfect for you.
You will learn:
How to connect Power Query to Excel and CSV files,
The steps to pull live data from a web-based source (World Population dataset),
and Pro tips to manage your imported data efficiently.
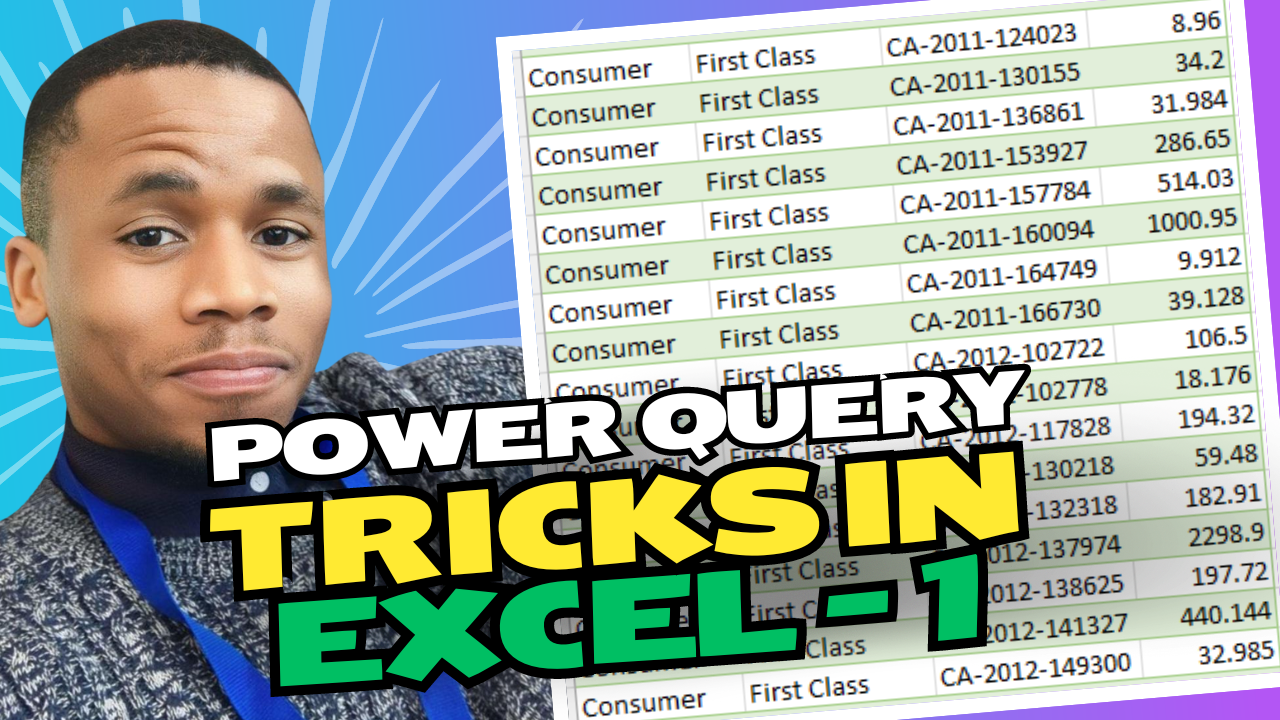
The objective of this series was to show a short demo of how to tranform a one-anchor or two-anchor columns from an unstructured data
to a well structured data in Excel using Power Query Editor.
Many atimes, this is what we face everyday in our offices, schools, businesses or places of assignment. With Power Query in Excel,
one can easily transform and clean data in Excel without outrageous formula.
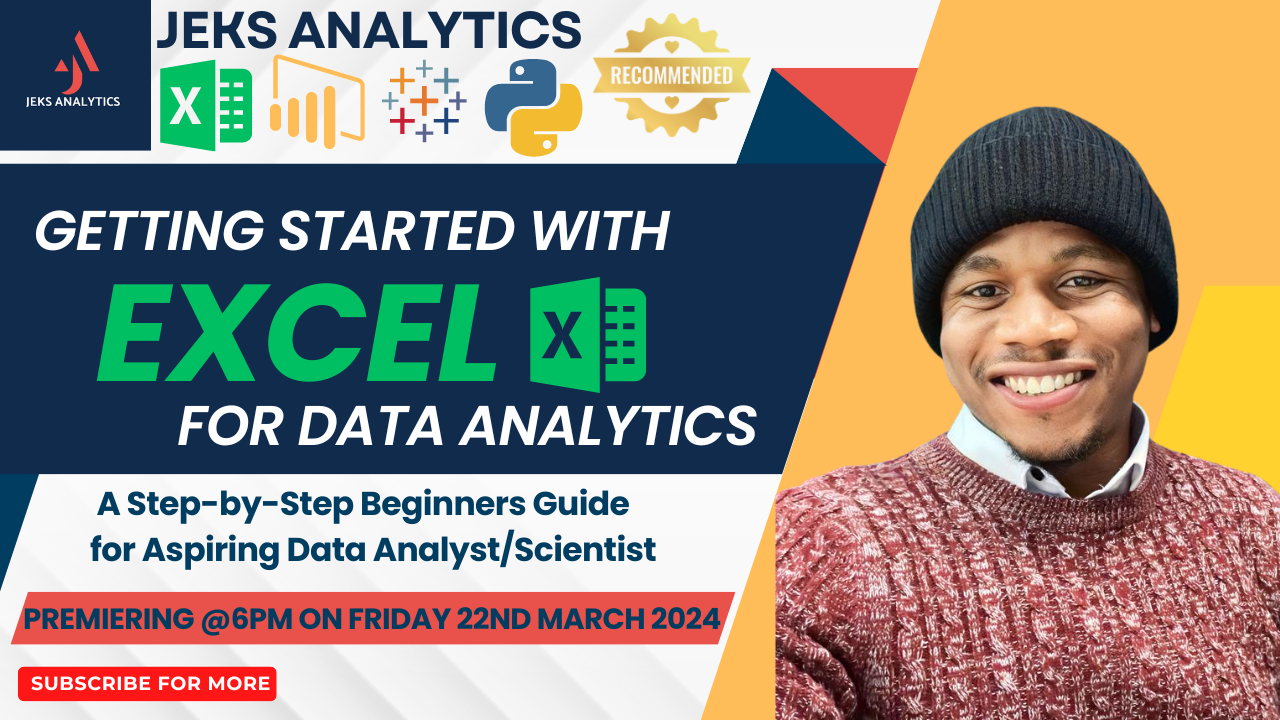
Dive into series for our Beginner's Guide to Data Analytics with Excel! In this power-packed session,
we simplified the world of data analysis using Microsoft Excel, the ultimate tool for beginners. Learn everything
from navigating Excel's interface to mastering essential functions for data analysis like SUM, AVERAGE, and IF statements.
Discover the secrets to cleaning and preparing your data for analysis, and unlock the potential of Excel as your go-to analytics
companion. Get ready to take your first step towards becoming a data analyst!
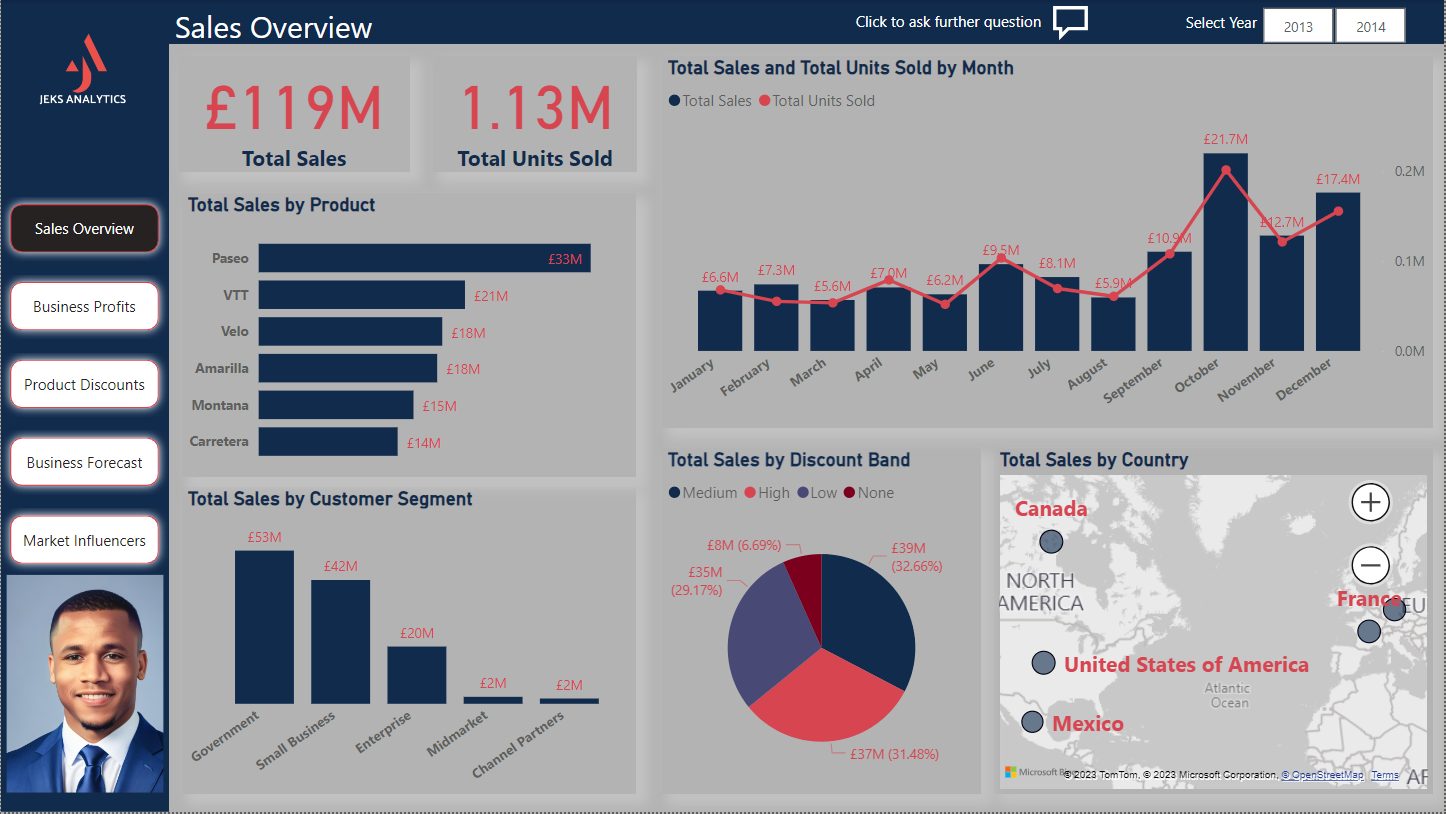
In this comprehensive tutorial series, we guide you step-by-step through building a stunning Business Financials Power BI Dashboard
from scratch. You will learn everything from importing sample datasets, working with Power Query, and designing impactful dashboards
to advanced techniques like AI-powered visuals, forecasting, and drill-through navigation. By the end, you will have the skills to
create dynamic, interactive dashboards that tell compelling data stories. Perfect for beginners and aspiring Power BI pros!
