Validate the data and economics before funding a controlled pilot.
The model concentrates historical churn in a limited contact list. However, refreshed source records change the commercial conclusion. Risk ranking alone cannot establish whether an offer will cause a customer to renew.
Historical events need a defensible timeline.
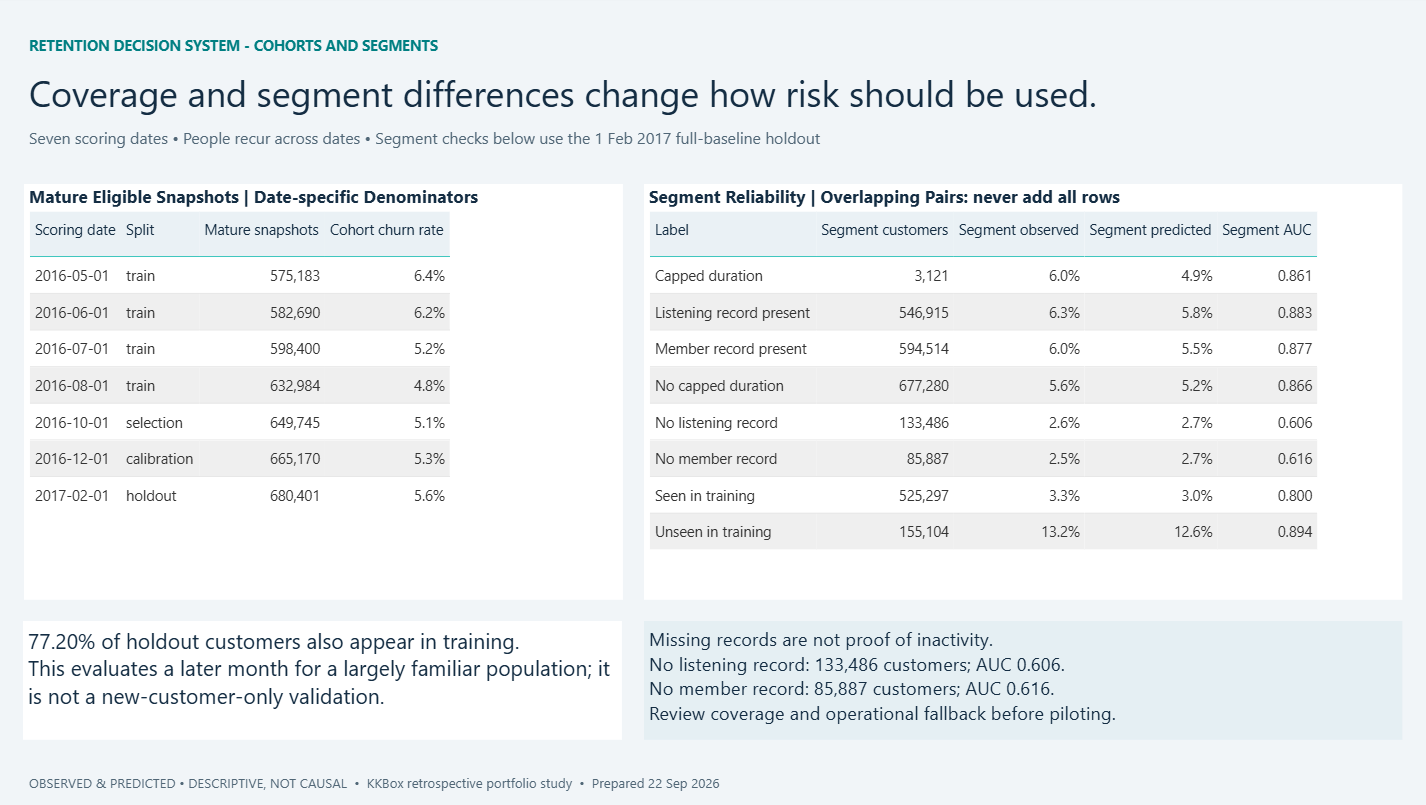
I reconstructed subscription cohorts from transactions, combined them with listening behaviour and built 38 predictors using events strictly before each scoring date. A seven-day intervention lead and a 30-day renewal-gap outcome keep the targeting question explicit.
The workflow audits 392 million original listening records, tests duplicate and time-boundary handling, and separates future outcomes from past features. Backdated records in a refreshed release are tested as an alternative label source.
Strong concentration of risk, with clear limits.
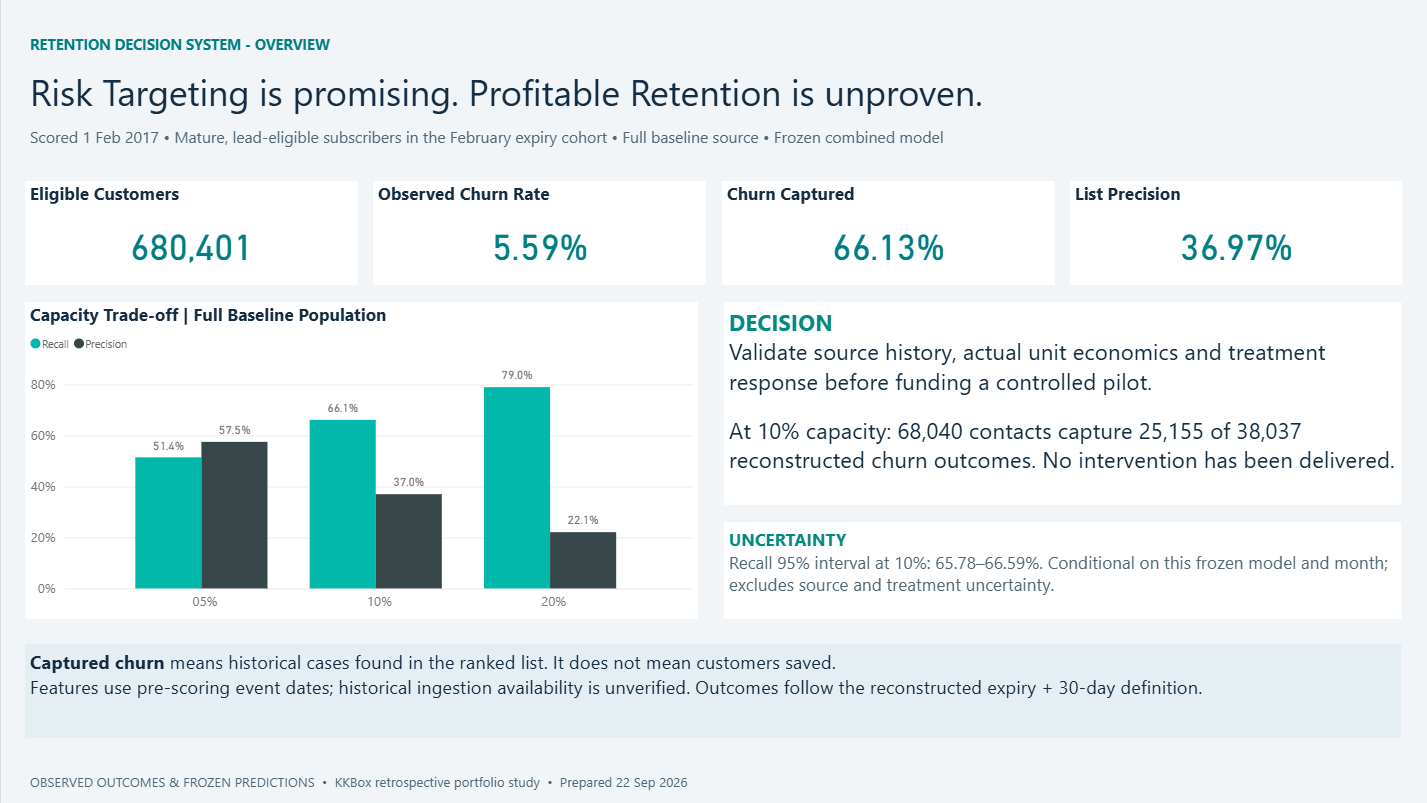
The selected logistic model combines transaction and listening features. At 10% capacity, 68,040 contacts contain 25,155 of the 38,037 reconstructed churners.
| Final-test measure | Result | Interpretation |
|---|---|---|
| Precision at 10% | 36.97% | Historical churn among selected customers |
| Recall at 10% | 66.13% | Share of all reconstructed churn captured |
| Lift at 10% | 6.61× | Concentration relative to the 5.59% churn rate |
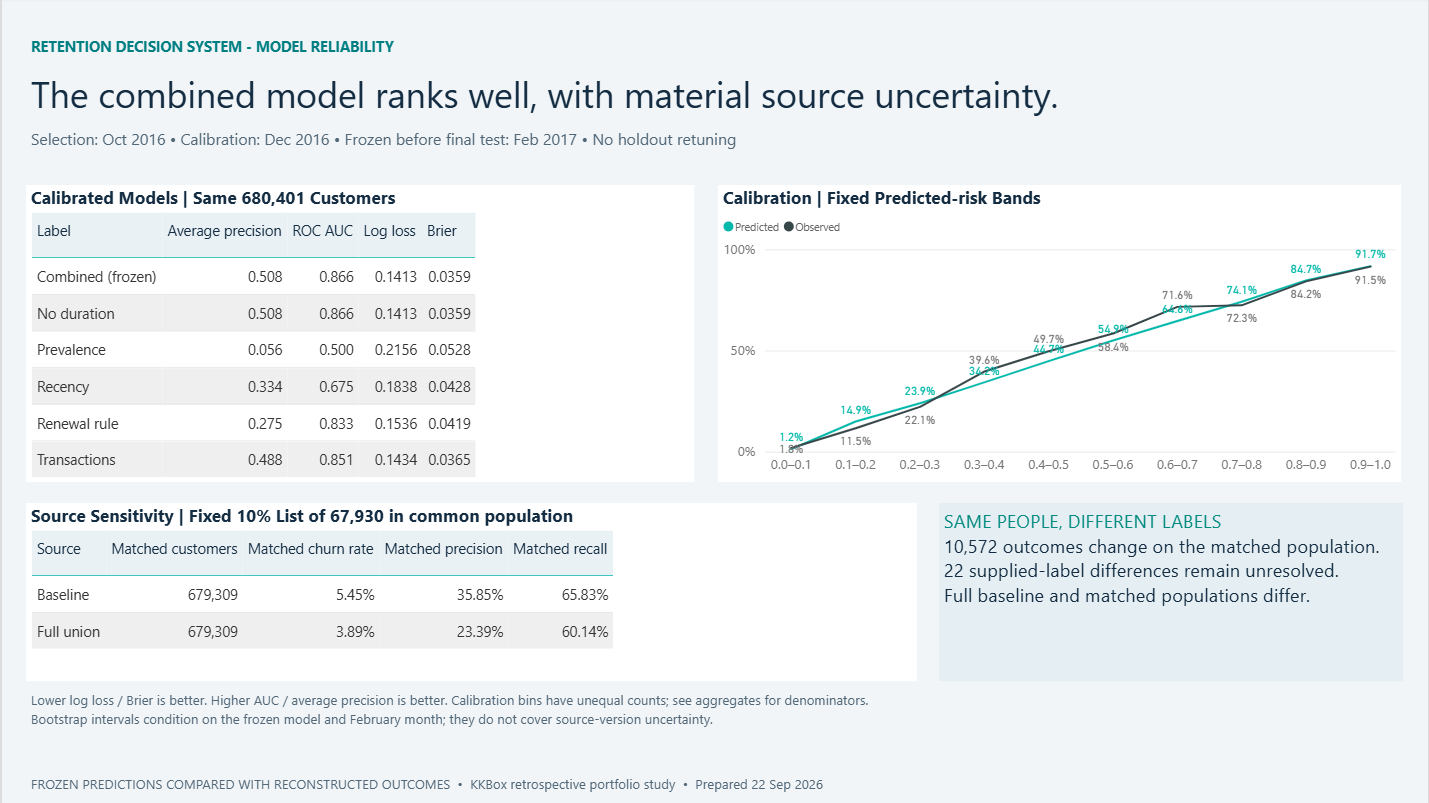
| Average precision | 0.508 | Compared with 0.488 for transactions only |
| AUROC | 0.866 | Overall ranking across the final cohort |
Recall has a conditional 95% customer-bootstrap interval of 65.78–66.59%. This describes the frozen model and observed month; it does not cover all future-market or source-version uncertainty. Model evidence and limitations.
A source update can reverse the funding decision.
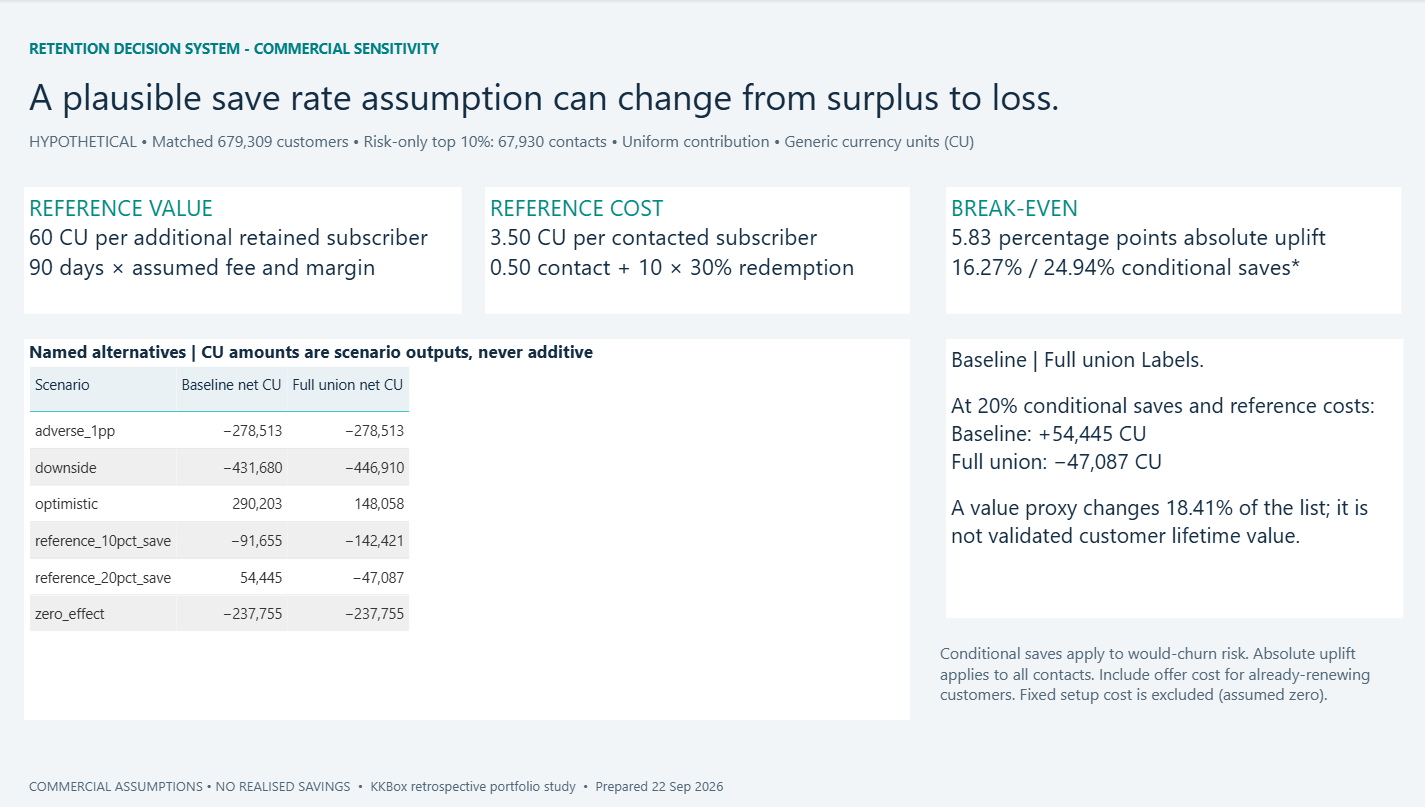
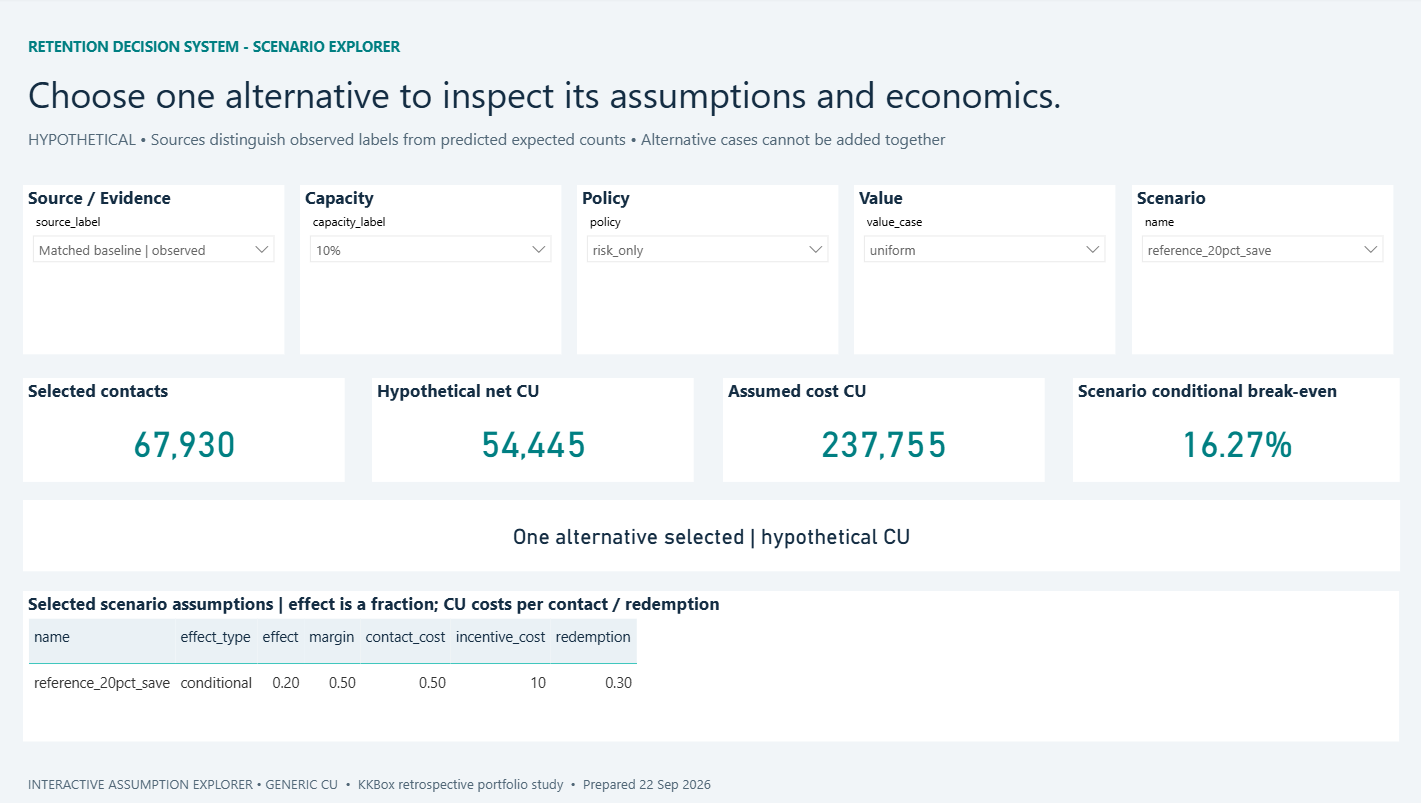
On the common population, a fixed list of 67,930 contacts is assessed under both label sources. With assumed retained contribution of 60 generic currency units (CU) and contact/offer cost of 3.50 CU per customer, the required conditional save rate rises from 16.27% to 24.94%.
Assuming 20% of would-be churners are saved gives +54,445 CU under baseline labels and −47,087 CU under refreshed labels. These are scenario estimates, not realised profit or measured treatment effects.
Commercial assumptions, capacity comparisons and sensitivity.
Six pages connect evidence to a decision.
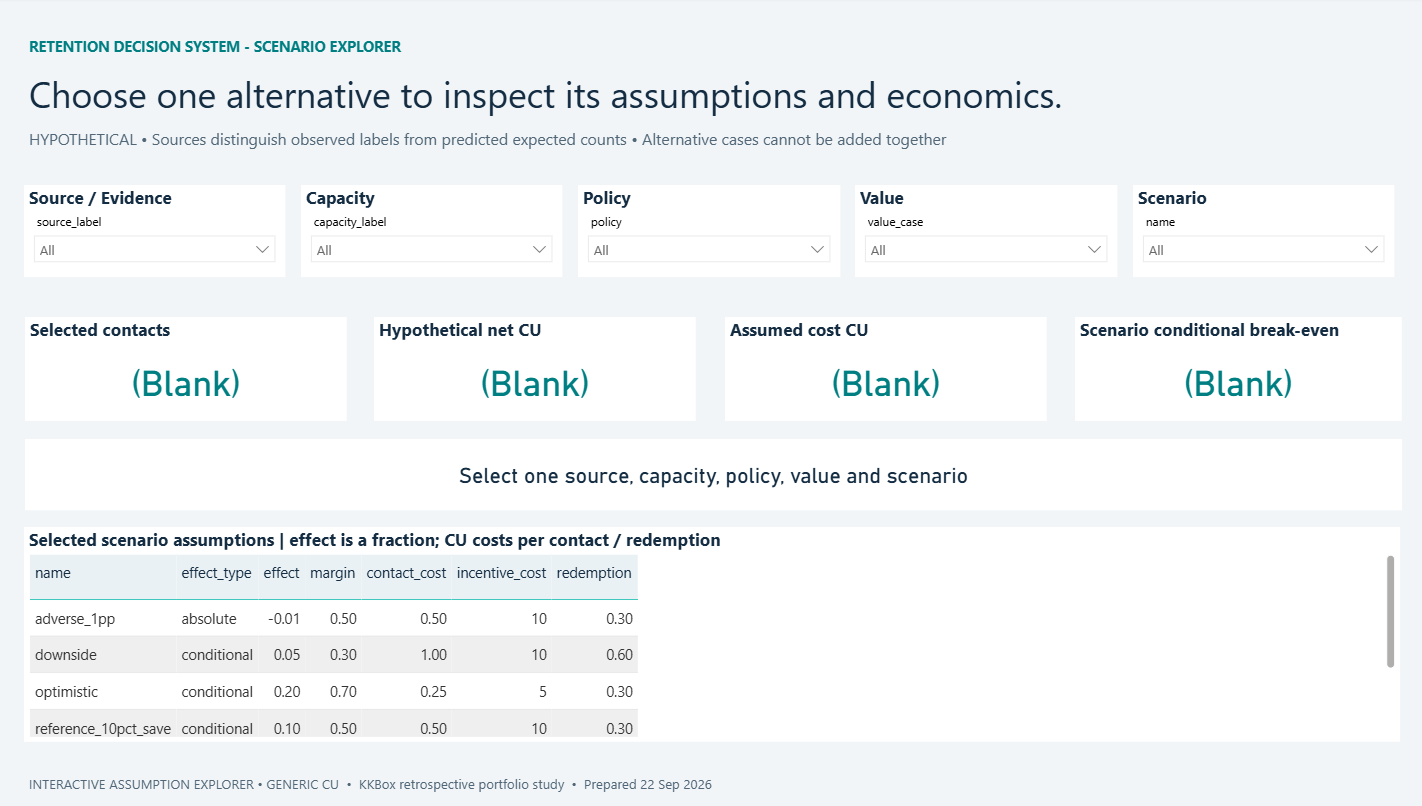
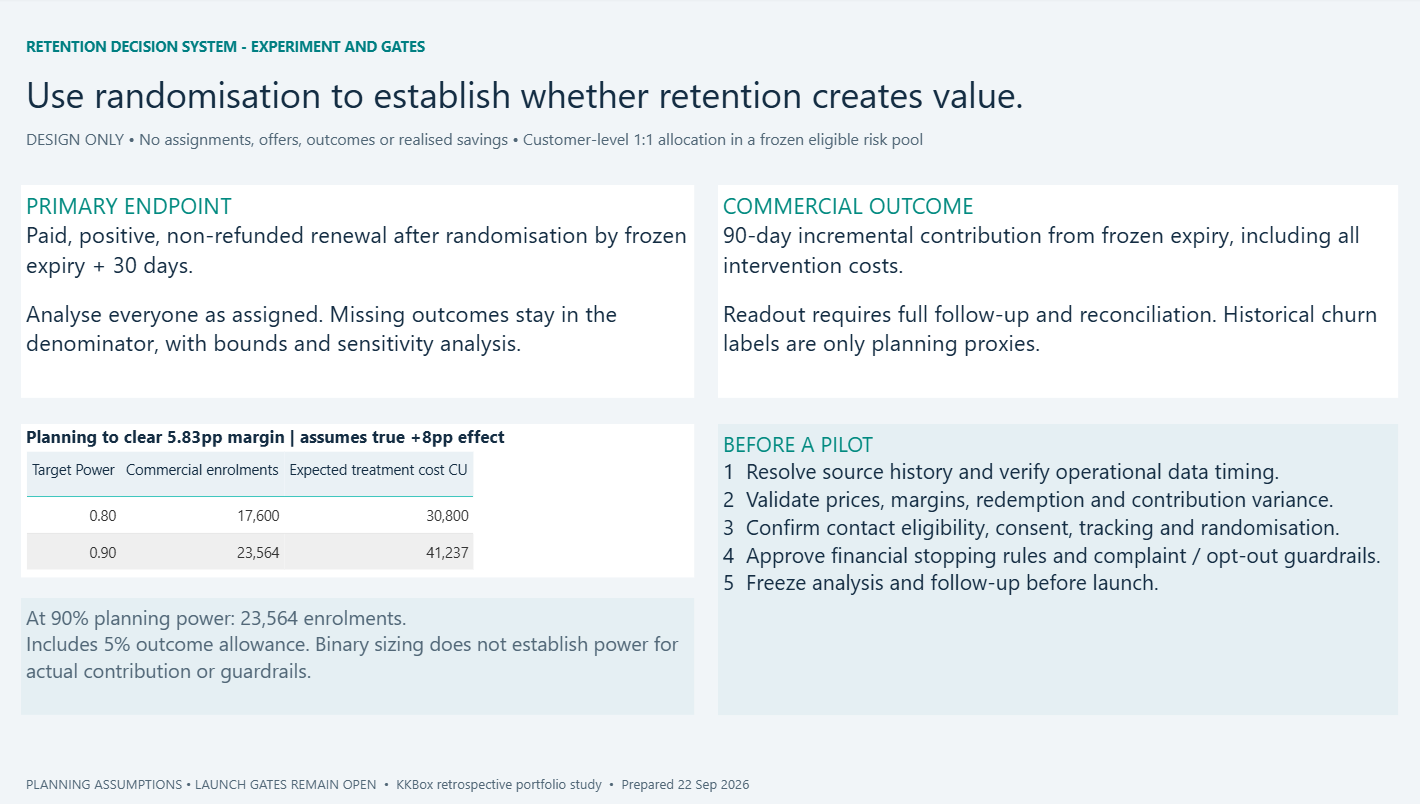
The report covers cohorts, model reliability, commercial sensitivity, a guarded scenario explorer and experiment gates. Select an image to inspect the report at full size.
Download the Power BI project and handoff. The public report contains aggregate evidence only.
Make the uncertainty part of the recommendation.
Independent checks reconcile 7,000 sampled labels, 16,100 listening-feature values, 96 model metrics and 5,604 commercial values. Versioned SQL, pinned dependencies, a frozen evaluation plan and a separate final reproduction record make the work inspectable.
Final reproduction and publication record · Proposed experiment
From reproducible evidence to a bounded recommendation.
This portfolio project demonstrates analytical design, data quality, SQL engineering, temporal model evaluation, commercial reasoning and executive communication. It is an independent case study, not work commissioned by KKBox.