Use Men's E-Mail when campaign economics clear the documented threshold.
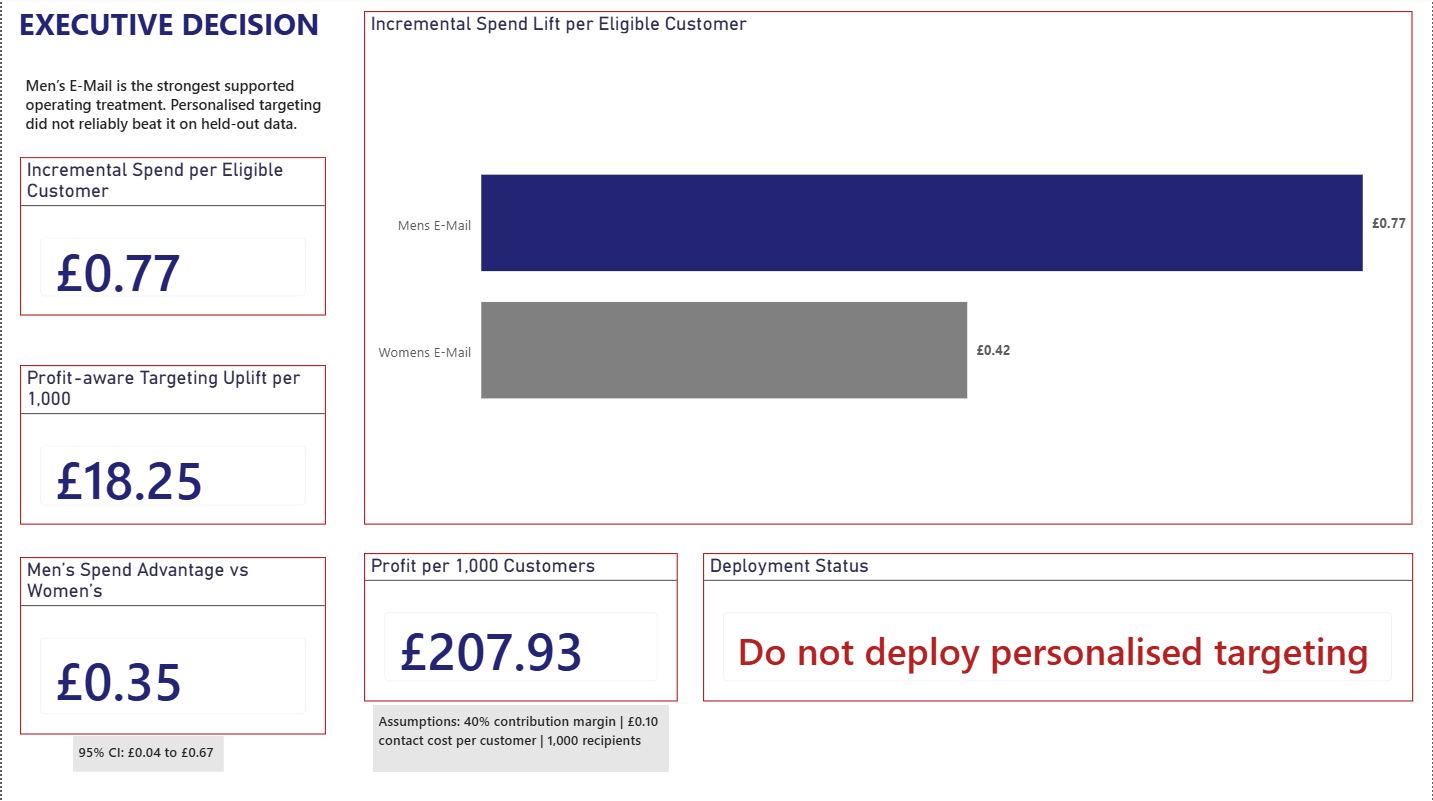
Men's E-Mail generated the strongest causal and commercial result. The personalised targeting policy was not approved for deployment because its held-out profit advantage was too uncertain to justify replacing the fixed treatment.
Move beyond campaign response to incremental value.
The decision was not simply whether emailed customers purchased more. A useful recommendation had to separate revenue that would have occurred anyway from revenue caused by treatment, connect the causal effect to contribution economics, and determine whether customer-level targeting improved the decision.
The analysis therefore used spend per eligible customer as the primary commercial outcome, with visit and conversion as supporting behavioural measures.
Decision hierarchy
- Validate that the randomised comparison is credible.
- Estimate treatment effects against No E-Mail.
- Compare Men's and Women's treatments directly.
- Translate incremental spend into contribution profit.
- Test whether segmentation or personalised targeting improves on the strongest fixed policy.
Both treatments created value; Men's E-Mail created more.
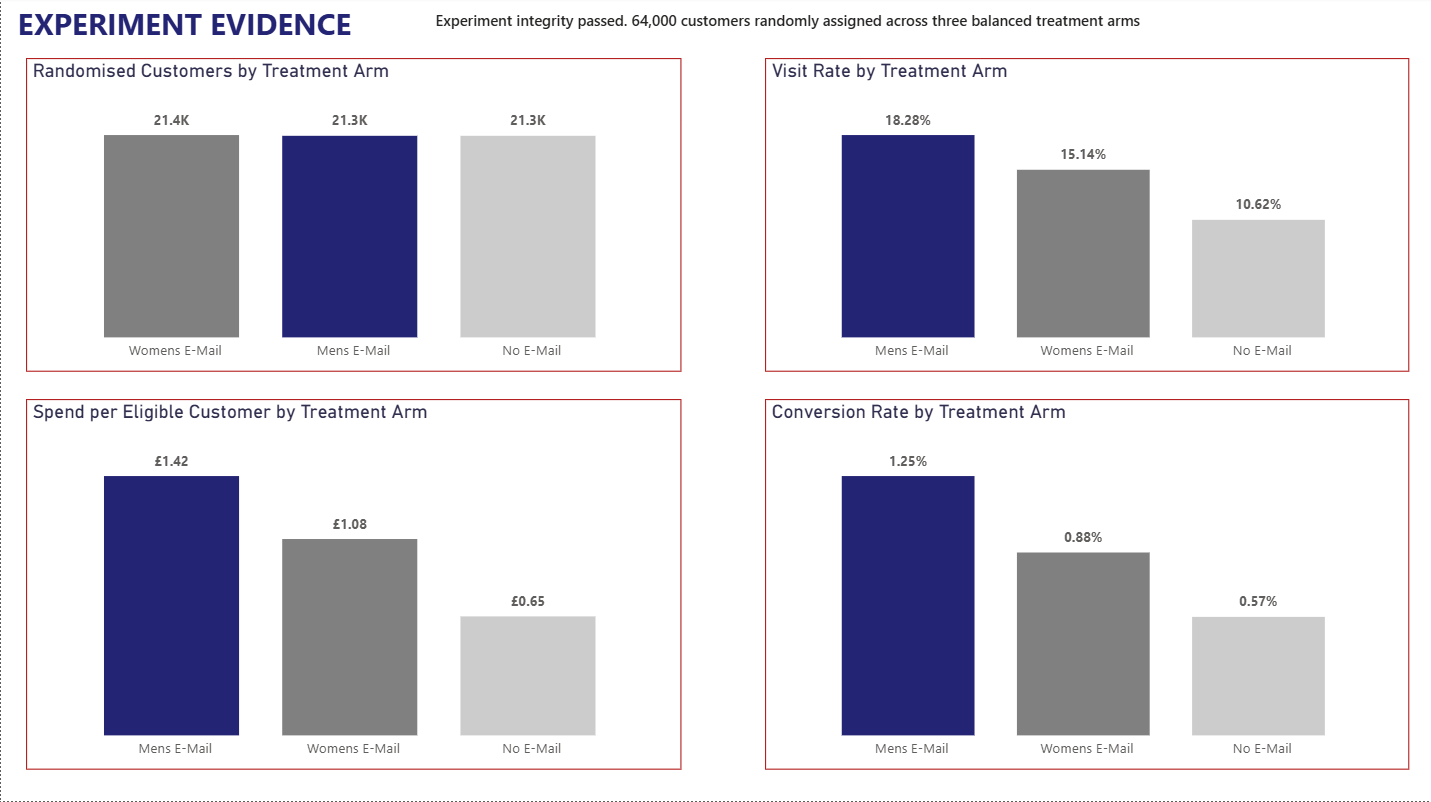
The experiment passed treatment-allocation, data-quality and baseline-balance checks, supporting an intention-to-treat comparison across all assigned customers.
| Comparison | Visit lift | Conversion lift | Spend lift / customer | Decision implication |
|---|---|---|---|---|
| Men's vs No E-Mail | +7.66 pp | +0.68 pp | +£0.770 | Strongest value-creating treatment |
| Women's vs No E-Mail | +4.52 pp | +0.31 pp | +£0.424 | Value creating, but weaker overall |
| Men's vs Women's | +3.14 pp | +0.37 pp | +£0.345 | Direct evidence supports Men's |
The direct Men's-versus-Women's spend difference had a 95% confidence interval of approximately £0.04 to £0.67 and remained significant after multiplicity adjustment.
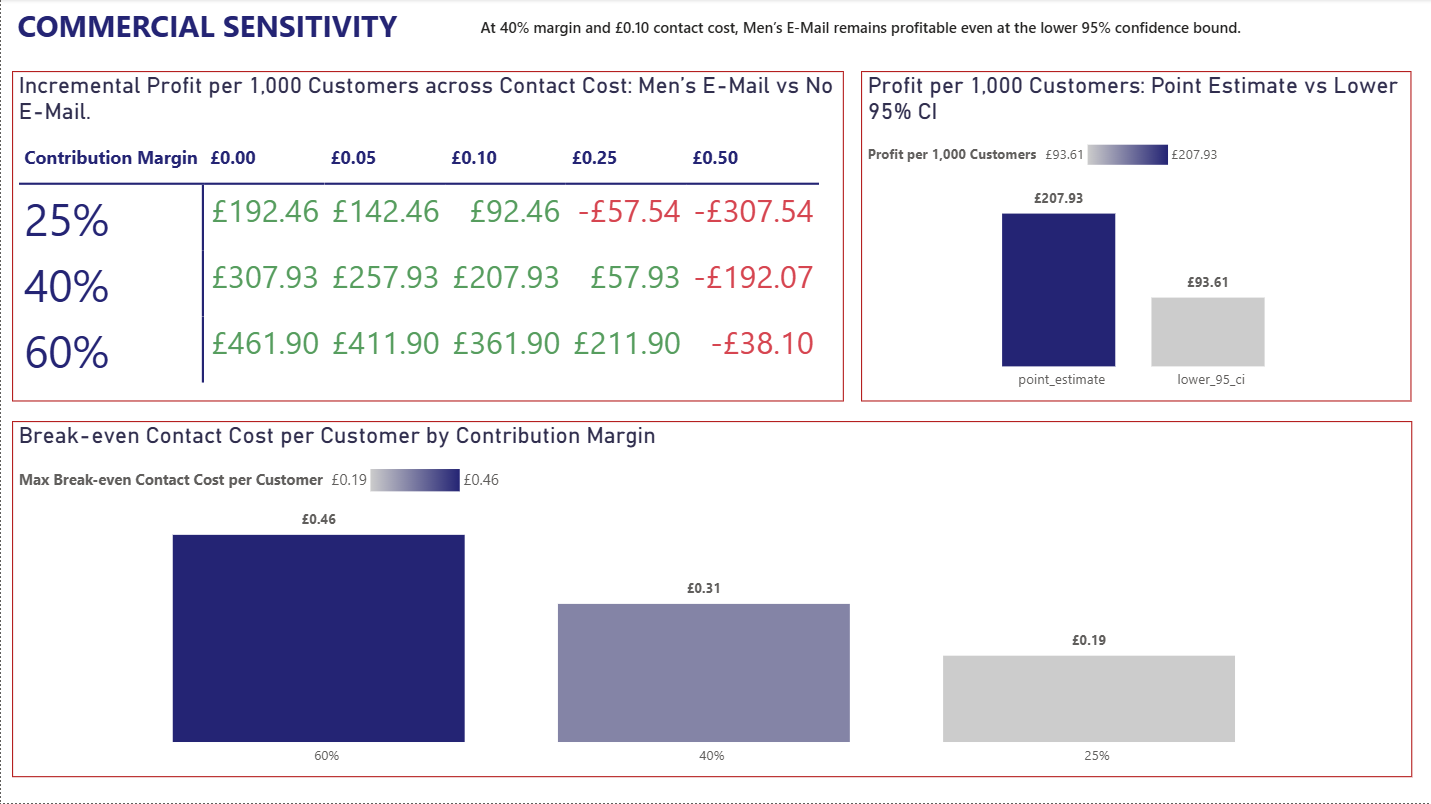
Statistical lift was converted into an operating threshold.
At a reference scenario of 40% contribution margin and £0.10 contact cost per customer, Men's E-Mail generated approximately £208 incremental profit per 1,000 eligible customers, compared with approximately £70 for Women's E-Mail.
Men's E-Mail also had the wider break-even cost buffer, making the recommendation more resilient to changes in contact cost or contribution margin.
Commercial guardrail
Observed campaign revenue was not treated as incremental revenue.
Profit was derived from the randomised spend effect and explicit margin/contact-cost assumptions, keeping causal evidence separate from business assumptions.
The more complex policy did not earn deployment.
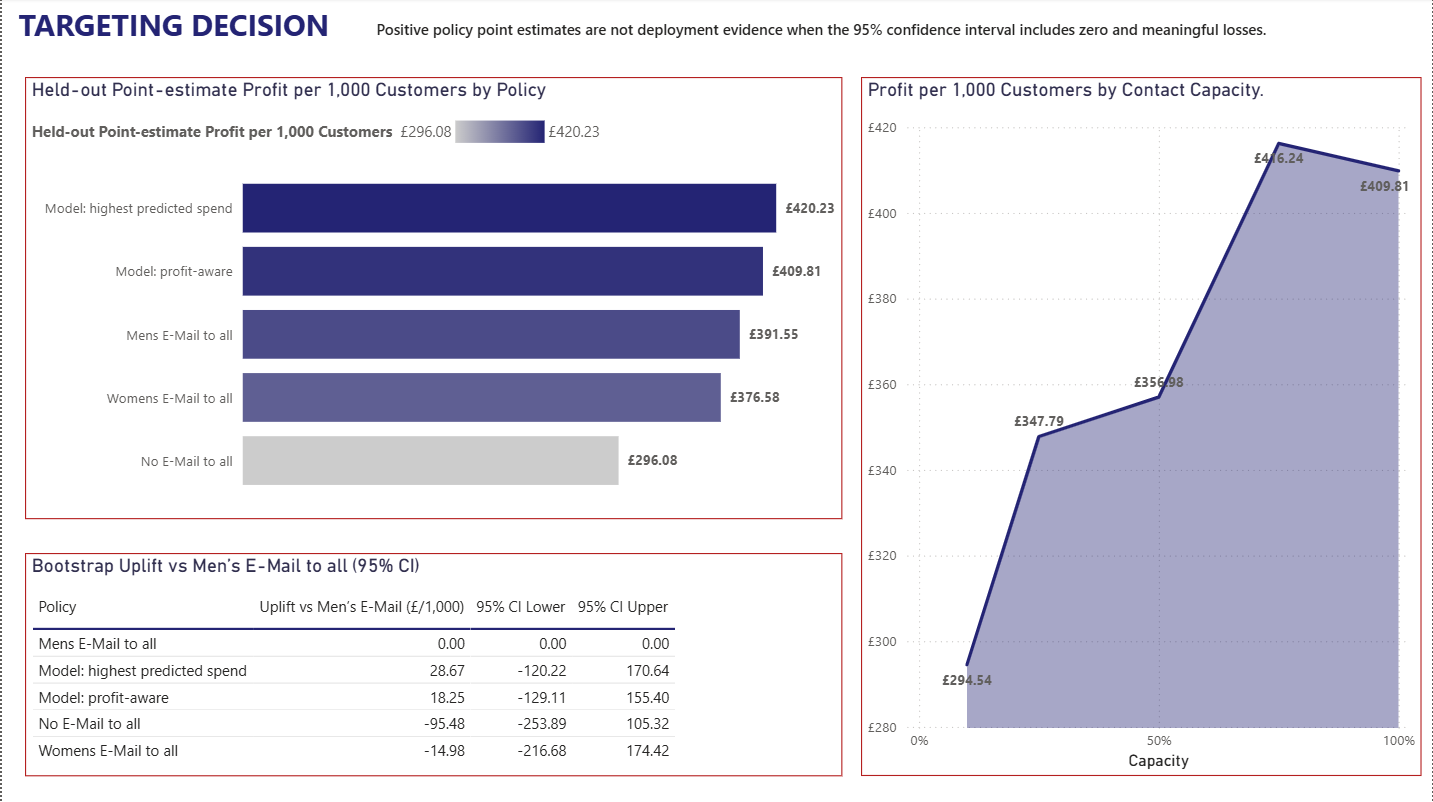
Pre-specified segment interaction tests did not support a manual treatment rule. A personalised policy was then evaluated on a 19,200-customer randomised holdout against Men's E-Mail to all.
The profit-aware policy showed a point uplift of approximately £18 per 1,000 customers, but its 95% bootstrap interval ranged from approximately -£129 to +£155.
Decision: keep personalisation exploratory. The model could rank customers, but it did not demonstrate sufficiently reliable incremental policy value.
Why the model was rejected
- The strongest fixed treatment was the benchmark.
- Evaluation used unseen randomised holdout data.
- The estimated improvement was positive but imprecise.
- The interval included no improvement and meaningful downside.
Four pages, each built around a decision.
The dashboard moves from the recommended action to the experimental evidence, commercial sensitivity and final targeting decision.
Evidence was held to a higher bar than model complexity.
The analysis retained all 64,000 assigned customers, used pre-treatment features for segmentation and targeting, adjusted related comparisons for multiplicity, and required personalised policies to beat the strongest fixed benchmark on held-out randomised data.
The final recommendation deliberately separates prediction, causal treatment effect and deployable policy value.
Important limitations
- One retailer, campaign context and outcome window.
- No unique customer identifier in the source data.
- Spend is rare, zero-inflated and highly skewed.
- Commercial conclusions depend on stated margin and cost assumptions.
- Prospective randomisation is still required before claiming personalised-policy uplift in operation.
Reproducible analysis, decision reports and methodology are available on GitHub.
The repository contains the validation workflow, treatment-effect analysis, segment tests, held-out policy evaluation, decision documentation and Power BI outputs behind this case study.